New Scan: Trends in Multiple Timeframes
I just added another new scan thanks to Rick, who pointed out to me that this functionality was missing. As I told him, I guess I was too close to the forest to see the trees. I should have had this scan a long time ago, given that I've had the trend tables on the stocks since day one. So this scan allows you to find stocks based on what appears in the trend table on the individual stock pages. For example, BERY, which yesterday had this trend table:

- Long-Term Trend: Up
- Intermediate-Term Trend: Up
- Short-Term Trend: Down
New Feature: Sort the All Stocks Page... Plus Volatility
By popular demand, you can now sort the stocks in the "All Stocks" page! When I first created that page I never thought people would actually use it -- I really made it so that search engines could index the site easily. But, increasingly over time, people have been asking for the ability to sort the list of stocks, mainly because they wanted to sort by the letter grades.
Well I've enabled that plus sorting by other columns as well. You can simply click on the column header you wish to sort by. The first click will sort ascending and a subsequent click will reverse the sort.

Announcing Annual SwingTradeBot Plans!
I'm happy to announce the launch of annually-billed Pro plans! I've been asked about a yearly option several times and since I aim to please, here they are.

By opting for a yearly plan you can save up to 30% vs monthly billing. Annual pricing is the equivalent of:
- Gold Plan: 2 months free
- Platinum Plan: 3.5 months free
You can select annual billing on the Pricing Page. Just click the appropriate button which has the text "Annual Billing".
For those of you who are already on a monthly Pro (paid) plan if you switch over any remaining credit on your current plan will be applied to the annual plan's price. So, for example, if you are on the Gold Plan ($10/month) and switch halfway through your month, $5 will be credited toward the annual plan and you'll only be charged $94 to switch instead of $99.
As always, I'm happy to answer any questions. And now it's easier than ever to contact me. You can just hit me up via the little chat bubble in the bottom of every page on the site.
Read More ➞Hover Charts Simplified
Update: /blog/you-can-now-view-scan-results-as-a-list-of-chartsNow there's an even faster way to view the charts.
I just made a change to the way the hover charts are launched. It is now easier to know where the charts are available and it should also be simpler to display them on Android devices. You'll now see a little chart icon next to stock ticker symbols in many of the tables around the site. Here's an example (If the image isn't animated, try clicking on it):

On a laptop or desktop computer you can simply hover your mouse pointer (cursor) over the chart icon and that stock's candlestick chart will appear. On mobile devices you can just tap the icon to reveal the chart. A second tap somewhere else on the screen will close the popped-up chart.
Read More ➞A New Coat of Paint for the Site
You may notice that the site looks a little different today. I've been wanting to change the site's theme (template) for a long time and I finally got around to doing it. Things are pretty much in the same location as before, so hopefully you'll still be able to find your way around. Please let me know (leave a comment below or email me at swingtradebot-at-gmail-dot-com) if you run into something strange and/or broken.
There were a couple of technical issues with that old theme that have always bothered me -- like when the menu would get finicky about staying open -- plus it was starting to build up a good bit of technical debt. So I'm glad to have the shiny new theme in place. I have a few more things to tweak but then I'll be able to turn my focus back to feature development and adding more help/educational content to the site.
Read More ➞How to Get a Read on the Market
As a long time CANSLIM fan, I'm a firm believer in the importance of the 'M' part of that acronym - "Market Direction". According to IBD:
if the overall market is in a downtrend, it will be very hard for even the best stocks to move higher. That's because 3 of 4 stocks move in the same direction as the general market, either up or down.
(The "general market" refers to the major indexes, primarily the Nasdaq Composite, S&P 500 and Dow Jones Industrial Average.)
Simply put: If you buy a stock when the market is in a strong uptrend, you have a 75% chance of being right. But if you buy when the market is in a downtrend, you have a 75% chance of being wrong.
It's critical to me to have a read on what the broad market is doing. I used to use IBD's 'Big Picture' to get my market read but I find that I can reach the same conclusions using my General Market Analysis page. I've written before about how I use the General Market Overview page to get a read on the market as a whole. Last week I pointed out in my notes last week how choppy & trendless the market was looking. I want to go a little deeper into what it's telling me today.
Here's the trend table for the indices from today's General Market Analysis page: 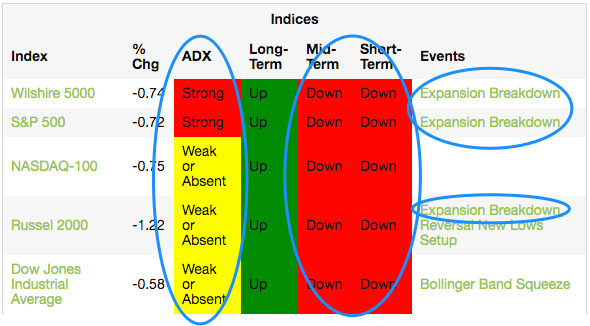
New Scans: Rising or Falling Relative Strength Ratings
I just released a couple of new scans. They allow you to identify stocks which have either rising or falling relative strength ratings. The letter grades that you see around the site are essentially relative strength ratings and these scans focus on those grades. Here are the scans:
Read More ➞Lessons Learned From My 2016 YTD Trading Results
I thought I'd share some thoughts I had while reviewing my trading results so far this year. Through today, the end of September 2016, the Nasdaq is up 6.08%, and the S&P is up 7.09% while my swing trading account is up 33.09%. While I'm happy to be outpacing the market by 4.5x, I'm a little disappointed that my account isn't up even more. That's because I know I missed a few trades that could have easily doubled or tripled my gains from where they are now. Nonetheless, I feel good that I've mostly stuck to my rules and that I'm still trading with a positive expectancy. Let's take a more detailed look.
Equity Curve
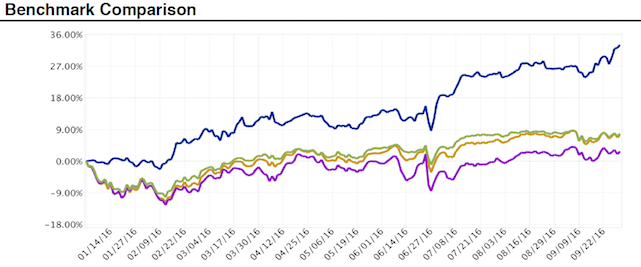
The dark blue line in chart above is my account and the green line is the S&P 500. What stands out to me when viewing my equity curve is that it's been a pretty orderly rise punctuated by some choppy, sideways action -- and then there was Brexit on June 27th. The primary reason for the sideways periods is that the market itself was chopping around and I try to do less when the market is not trending up or down.
Read More ➞New Feature: List Stock Scans by Type
 I just made some changes to the way the stock scans are displayed. First, I've moved the "Advanced" scans and combined them with the formerly named "Single Pattern" scans. So when you go to the scans page you'll see all of the scans listed along with the number of stocks that triggered for each scan.
The former Advanced Scans tab now is now "Scans by Type". I've taken a first crack at applying categories / labels / tags to every scan. Drilling down through the scans via those groupings should make it easier to home in on scans matching your particular style / strategy.
FInally, you may have noticed that some of the scans are marked as "Pro" now. People with a Pro (paid) subscription have full access to the results of those scans. If you're not a subscriber, the list of results will be limited for those scans.
I have a list of about 10 new Pro scans that I'll be adding over the next several weeks. So stay tuned for those to pop up.
Read More ➞Popular Now
Recent Comments
- TraderMike on BOOT
- Dr_Duru on BOOT
- TraderMike on Stochastic Reached Oversold
- SuccessfulGrasshopper897 on Stochastic Reached Oversold
- Cos3 on Adding float as advanced filter criteria?
From the Blog
Blog Tags
Featured Articles